
How Seasonality Affects Home Prices and Listing Activity

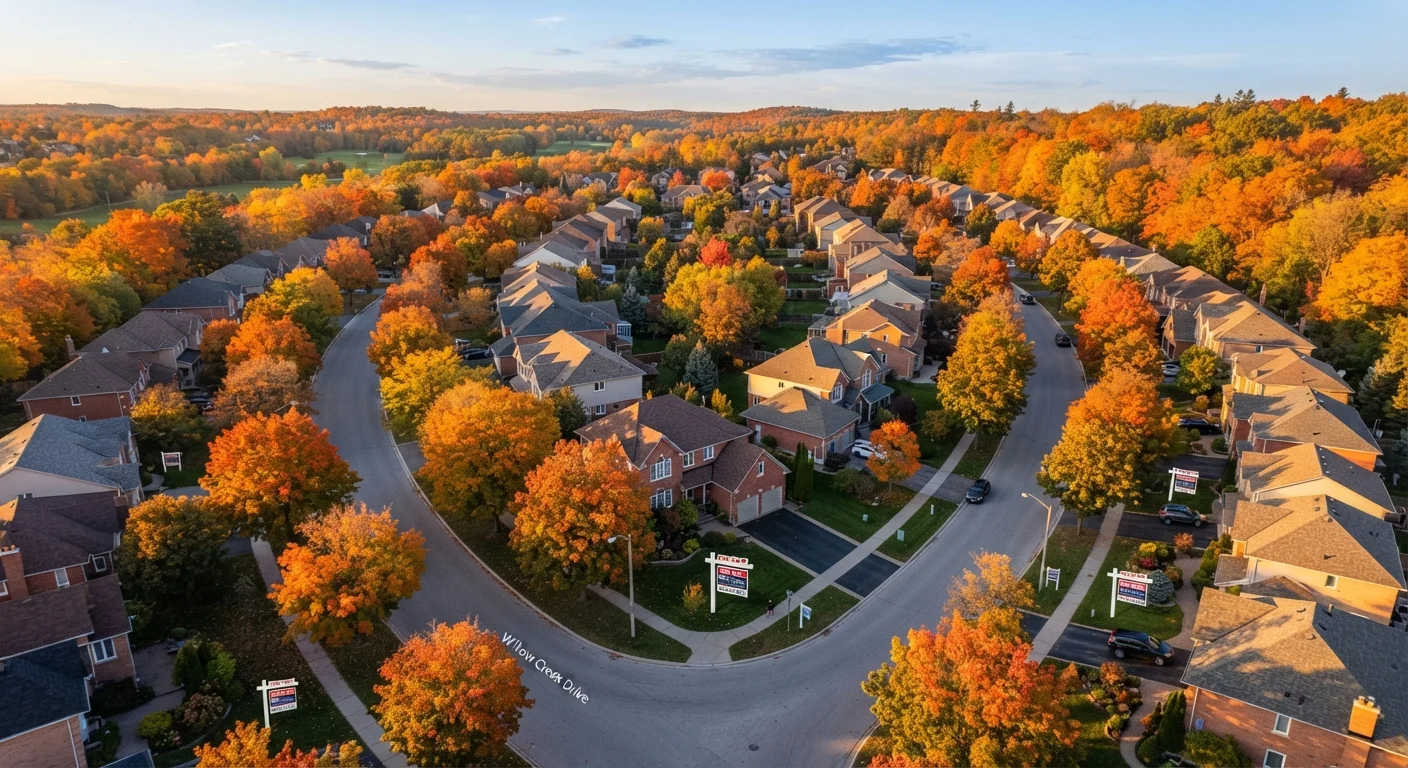
Photo: ShortwebArticles.com | Content For The Curious editorial
Key Takeaways
- Spring is historically the most active season for both listings and buyer competition in most US markets.
- Winter slowdowns tend to produce fewer listings but don't always mean lower prices in every region.
- Seasonal patterns vary significantly by climate, local economy, and housing supply.
- Buyers and sellers can use seasonal timing strategically, but market conditions always matter more than the calendar.
- National seasonal trends rarely tell the full story — local data is far more reliable for decision-making.
Why the Calendar Has Always Mattered in Real Estate
Real estate professionals have tracked seasonal rhythms for decades, and for good reason: the housing market doesn't operate in a vacuum. It responds to school enrollment deadlines, tax filing cycles, weather conditions, and the simple human desire to move when it's convenient. These practical pressures create recognizable annual patterns — not laws of physics, but consistent tendencies worth understanding.
The most durable pattern is the spring surge. From roughly March through June, more sellers list their homes, more buyers enter the market, and sale prices often reflect that heightened competition. Families trying to relocate before a new school year, buyers whose tax refunds have arrived, and homeowners who waited out the winter all tend to converge in the same window. The result is elevated activity that shapes both listing counts and what buyers ultimately pay.
~40%
Of annual home sales close in spring months
National Association of Realtors data consistently shows March through June accounts for a disproportionate share of yearly transaction volume.
15–25%
More listings active in spring vs. winter
Inventory counts in typical US markets swell significantly from January to April as sellers bring homes to market for peak buying season.
2–3 weeks
Fewer days on market in spring vs. fall
Redfin and Zillow market reports have historically shown homes sell noticeably faster during peak spring activity compared to autumn in most metros.
Understanding these patterns helps consumers interpret market headlines more clearly. As our editorial team notes in a guide to reading housing market news, confusing a seasonal lull with a broader market downturn is one of the most common errors everyday Americans make.
What Typically Happens in Each Season
Spring (March–June): Peak listing activity in most US markets. Buyers compete more aggressively, which can push sale prices above asking. Homes spend fewer days on the market. This is historically when the largest share of annual transactions close.
Summer (July–August): Activity remains elevated but often plateaus. Some buyers exit as vacation season and heat deter open-house attendance. Listings that didn't sell in spring may linger, giving buyers more negotiating room late in the season.
Fall (September–November): A secondary, smaller uptick sometimes appears in September as post-summer urgency returns. By October and November, activity slows. Motivated sellers may reduce prices to close before the holidays.
Winter (December–February): The quietest period nationally. Fewer listings and fewer buyers mean slower sales, but the buyers who are active tend to be serious. Some studies suggest homes sold in winter close closer to asking price on a per-transaction basis simply because casual browsers have exited the market.
Track Local Days-on-Market Data
Regional Variation: Why One Pattern Doesn't Fit All
National seasonal averages can mislead as easily as they inform. A polar vortex in Chicago produces a very different February housing market than one in Phoenix or Miami. Regional price forces mean that the same calendar month can represent peak season in one city and a dead period in another.
In Snowbelt markets — think the Midwest, New England, and parts of the Mid-Atlantic — winter slowdowns are pronounced. Physical barriers like snow and ice genuinely suppress open-house attendance and moving logistics. The spring rebound in these areas is often sharp and competitive.
In Sun Belt markets like Florida, Arizona, and the Carolinas, activity is more evenly distributed year-round. Some warm-weather metros even experience a winter lift driven by retirees relocating from northern states, which partially inverts the national pattern.
This regional complexity is worth keeping in mind when reading national housing reports. As we've covered in detail, common housing price myths often stem from applying national averages to local decisions.
How Buyers and Sellers Can Use This Information
Seasonal awareness is useful context, not a decision formula. A seller listing in January in a low-inventory market may fare as well — or better — than one listing in April during a glut of competing properties. Understanding whether you're in a buyer's or seller's market typically matters more than the month on the calendar.
That said, here's how to use seasonality as one input among many:
- Sellers in colder climates often benefit from listing in early spring before inventory floods the market. Clean, well-staged homes listed in late February or March can capture early-season buyer urgency.
- Buyers who can be flexible may find less competition and more motivated sellers in late fall and winter, though they'll face a thinner selection of homes.
- Both parties should compare current local listing counts and days-on-market data against prior years rather than relying on national averages or seasonal assumptions alone.
Seasonally Adjusted vs. Raw Data
Broader economic forces — mortgage rates, employment trends, and housing supply — ultimately exert more influence over prices than the season. Economic signals that move the housing market provides a grounded look at those factors.
This article is for general informational purposes only and does not constitute financial, investment, or real estate advice. Consult a licensed real estate professional for guidance specific to your situation and local market.
Frequently Asked Questions
The content on this site is for informational purposes only and is not a substitute for professional advice. Always consult a qualified professional for guidance specific to your situation.